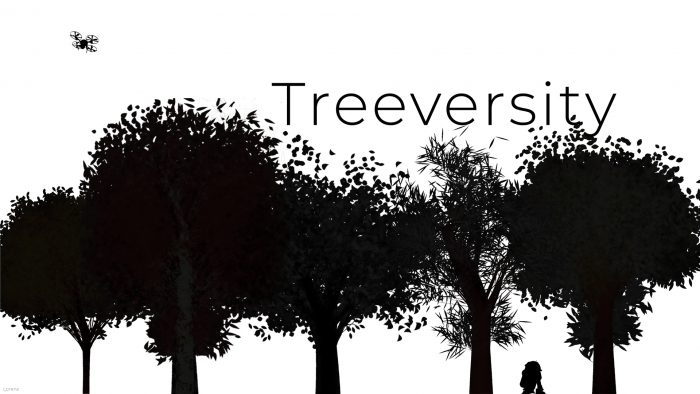
Treeversity

.
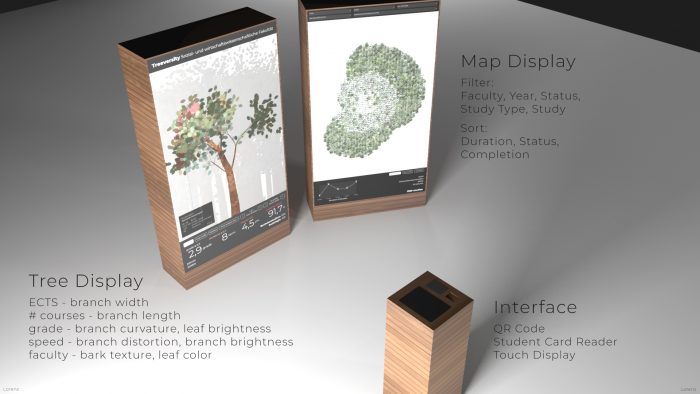
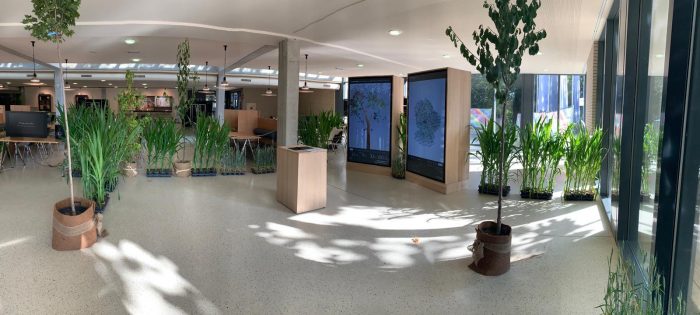
Treeversity focuses on the relation between complex data sets and the potential of data visualization to convey complex information at a glance. The Johannes Kepler University’s database contains approximately 268,000 enrollment records on 153,000 students, faculties, courses, rooms, exams, schedules and so on.
.
.
An interactive visualization, based on real date, illustrates this life as a tree. Courses, grades, and exams become branches, creating different types of trees. Fully grown or still nascent, withering or growing erratically. Each tells a story of the human behind it. You can imagine someone studying full-time, or balancing work, study, and children all at the same time. Realizing a bad choice or having found their destiny. Together, the trees reveal more. In all of the studies, what are the conditions, the evolutions, the successes, the drop-outs?
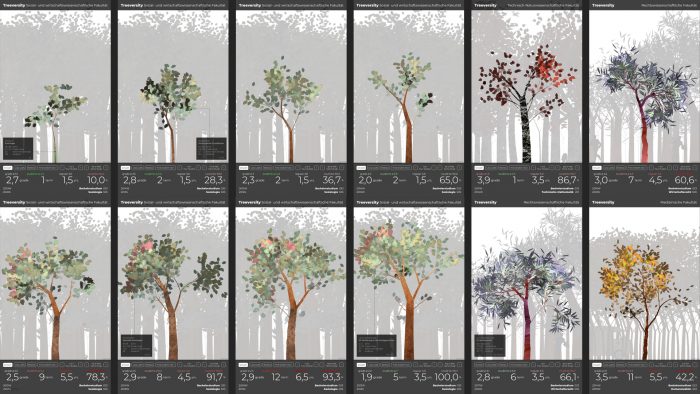
Treeversity shows the university as a forest, providing a tool to analyze its mechanisms at the same time. It illustrates the evolution of a study in a series of different trees, each of them allowing to assess and study the numbers behind it “at a glance”.
A trees structure is tied to the scientific field – for each study available at the university, the form of a tree will be similar. Its branches represent this structure in the same way the study is organized. The tunk being the result of the study as a whole, branches being study fields or modules that again carry all courses at the top of the tree.
.
.
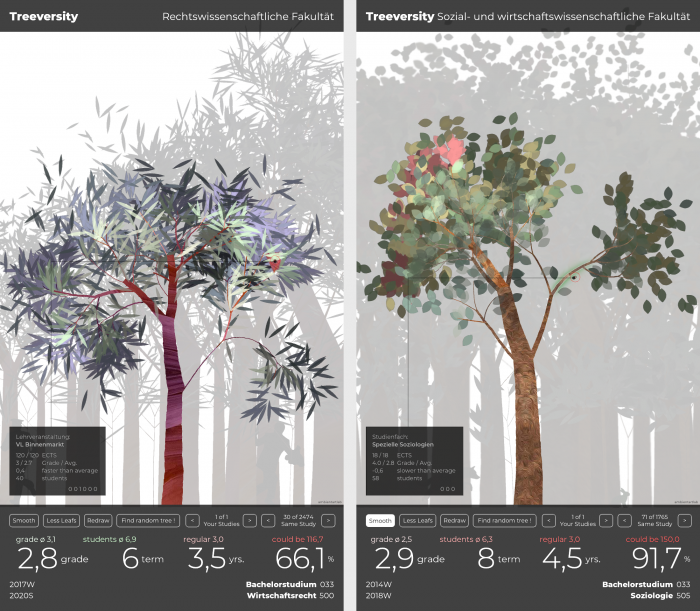
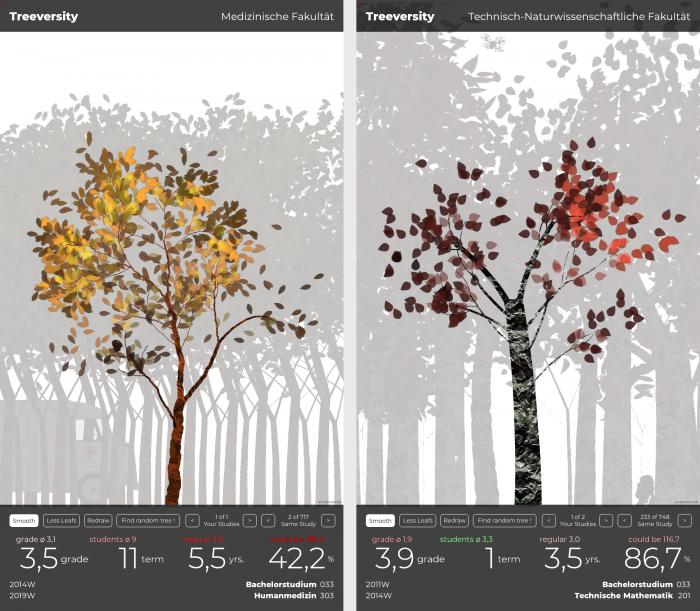
Different parameters from the database are responsible for various aspects. The colorset used for a tree identifies the four faculties – Law, Sociology and Economy, Technical and Natural Sciences and Medicine. The leaf-forms represent these faculties as well as the different fields of study within. Broad, short leaves refer to “early” studies, e.g. a bachelor degree, “medium” leaves to a masters degree while long, thin leaves point us to a PhD or asymmetric leaves to a pedagogical study.
.
The leaf color and the curvature of a branch are tied to the grades of each course and passed down through modules and study fields to the trunk, which “collects” these final, average values to create its form.
In this way, looking at a given tree, we can not only recognize the “success” rate of a student in terms of grades but identifies “areas of interest”. All elements of a particular study create a visual pattern that can help to find problematic areas within the whole.
Putting many – or all trees – aside each other, will then let us identify the state of a certain study field. Or compare different fields to each other.
.
.
Each tree can be studied further by touching each individual branch which will show the concrete numbers behind form and color.
In a similar way, the “wrinkliness” of a branch reports that a certain course has been finished later than usual. The later a course has been successfully completed, the more bend and wrinkled it becomes.
Again, passing on individual results to its “parent” branches to calculate the average values will combine them into a larger picture. In some cases, the tree looks rather deformed even though the leaves are generally bright – signifying a good to average grades but studying at slow speed.
In other cases the branches will be very straight, but the whole tree is relatively dark with curvy branches – that study may have been completed in a rather timely manner but with grades lower than average.
.
.
Still the reasons behind each tree can be manifold. Are there social or economical reasons behind it ? Has someone chosen a the wrong field of study ? Or are the university’s ressources or even the quality of education lacking ?
Treeversity – as a tool – allows us to better identify those areas of interest that may deserve closer investigation. Trying to lift the veil of numbers and create a visual image that tells as were to take a closer look at one glance.
.
.
.
From that day on he worked relentlessly to achieve what had become his biggest dream. “To fly ! How wonderful that must be !”
After all, that is what a university is all about…
.
Credits
Ambientartlab | Black moon
Thomas Lorenz (idea, concept, programming, interface design, artistic direction)
Florian Gruber (programming, interface design, co-art director video production)
.
Institute of Digital Business – Johannes Kepler University, Linz
Johann Höller (idea, overall concept, data expertise, data visualization modeling, overall project management)
Ursula Niederländer (project management / controlling, legal affairs, video production, project management)
Tanja Illetits-Motta (project management)
Raphael Blasi (project / quality management, video production)
Andreas Rösch (backend developer)
Stefan Küll (art director video production)
.
All images and videos are copyrighted under the rights of their respective holders. Use, distribution or modification is only allowed with the explicit permission of their owners.